What are Cycle Zones?
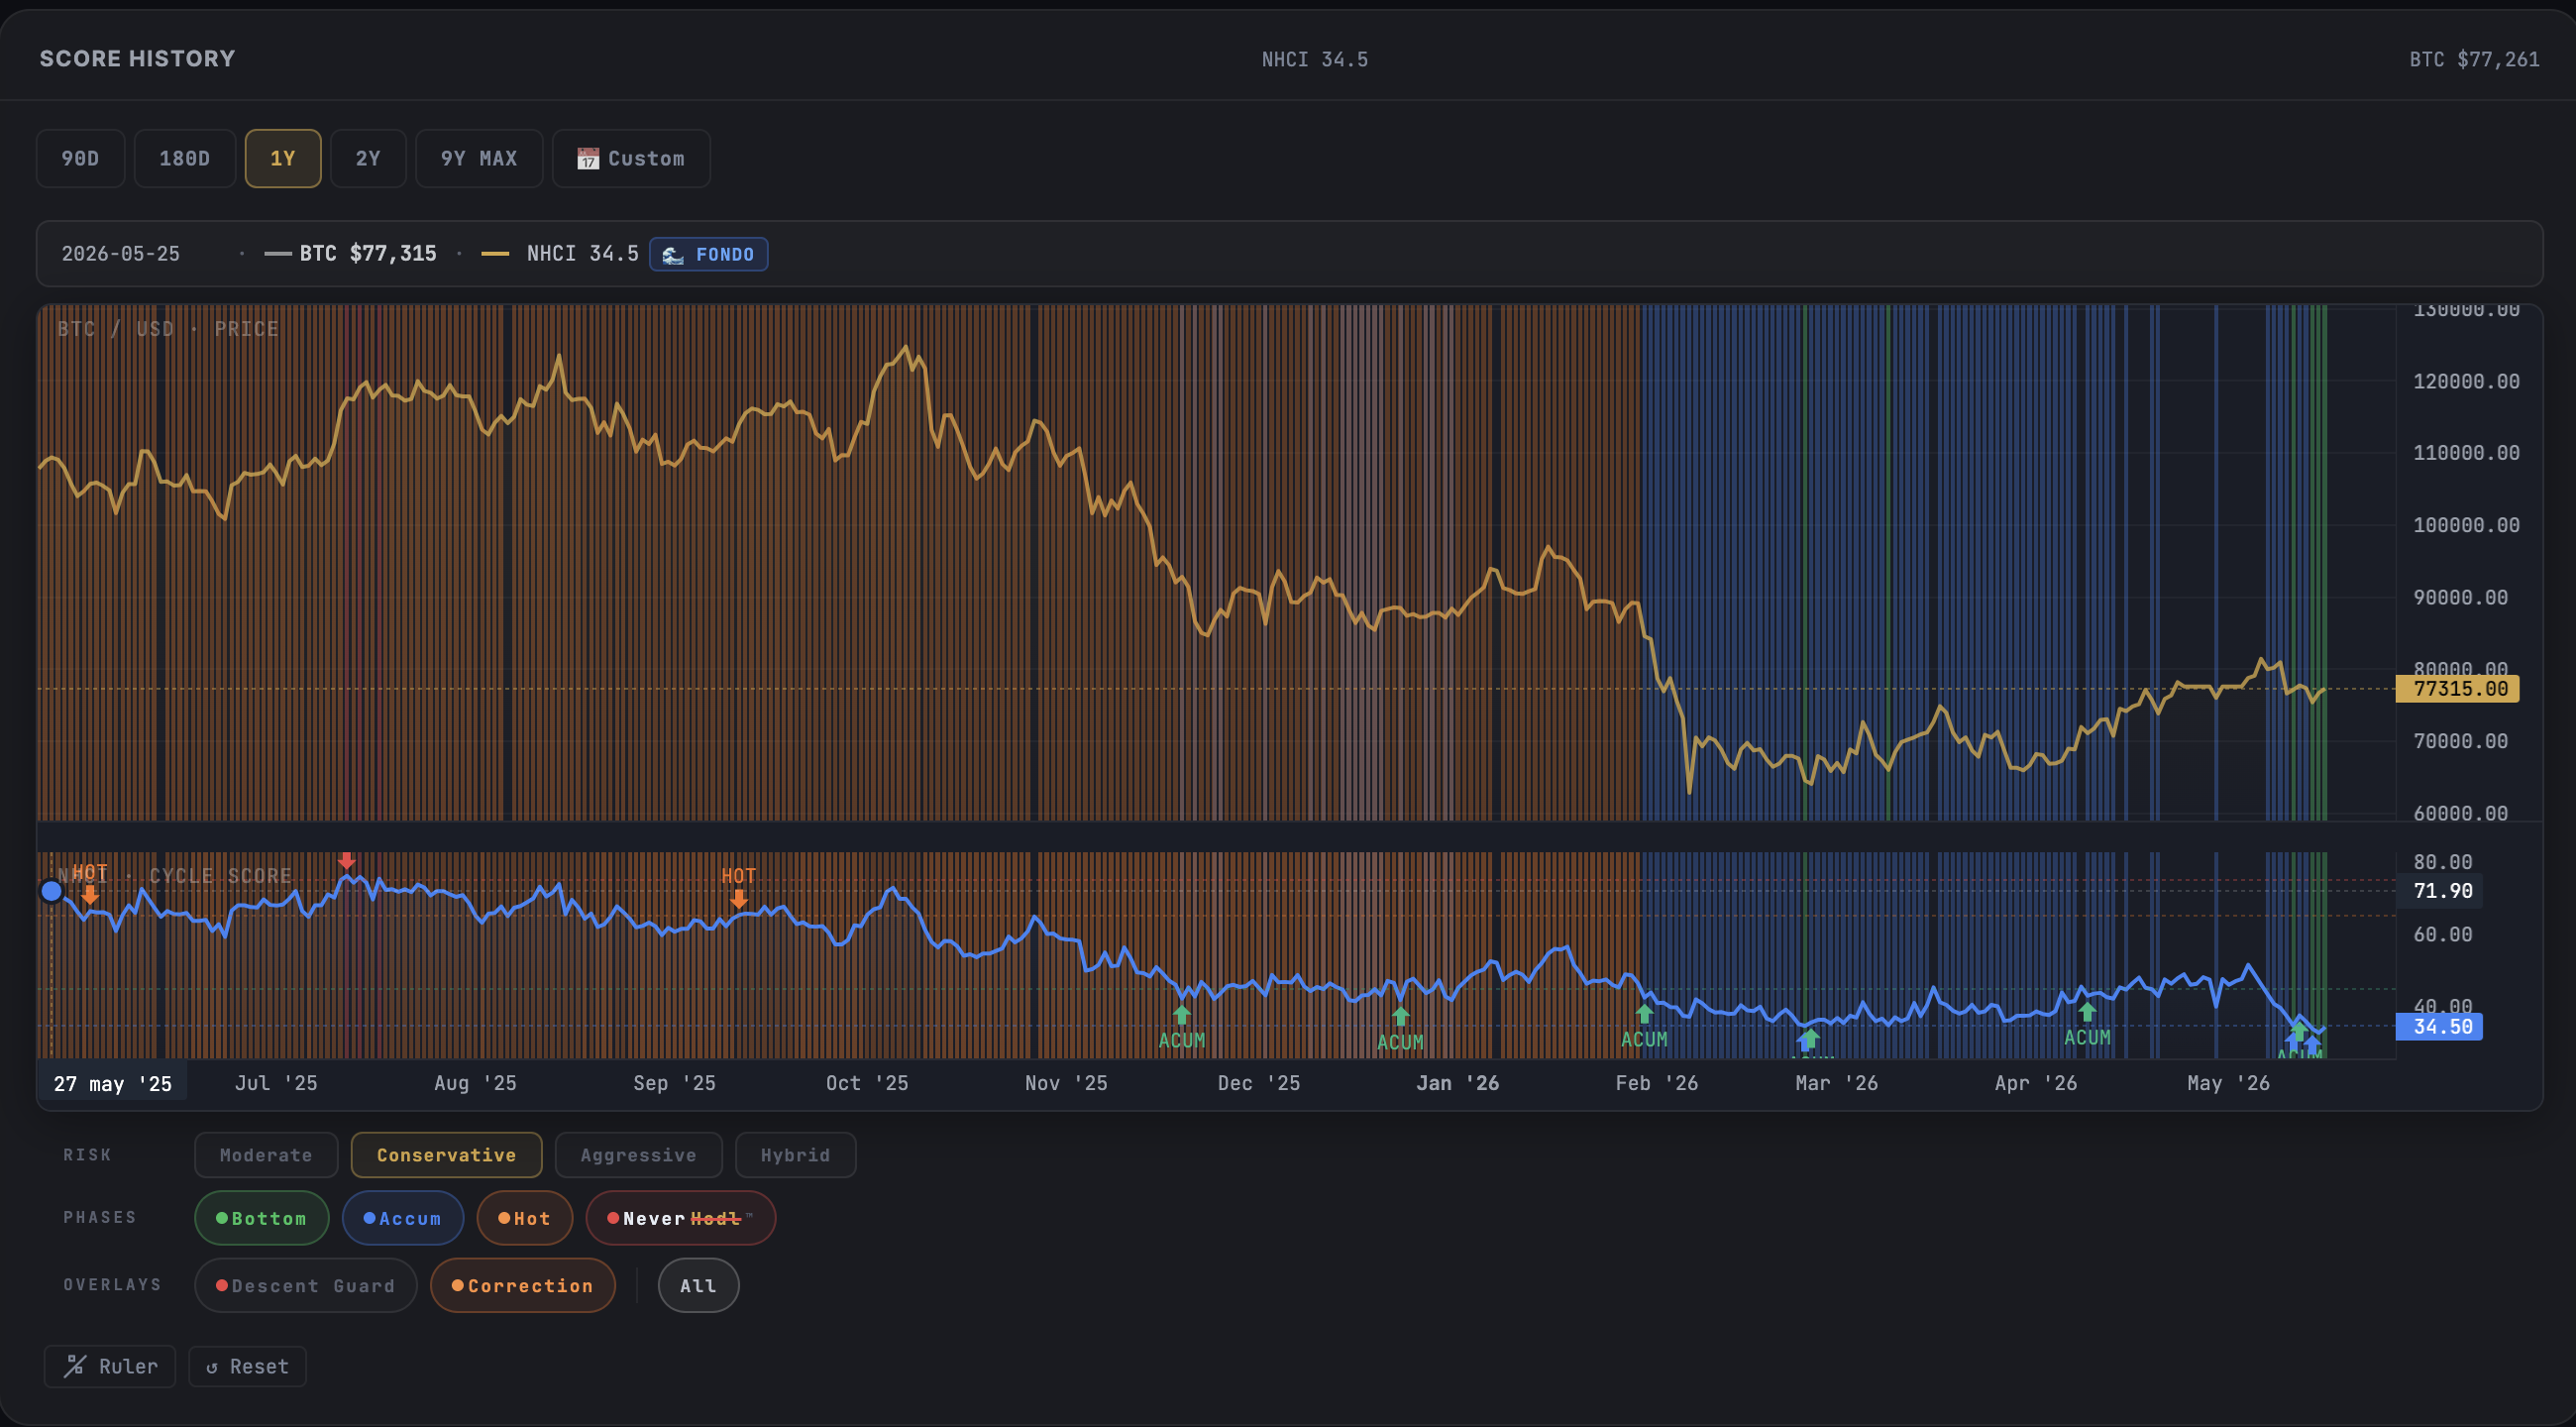
Cycle Zones are colored vertical bands painted directly on the NeverHodl™ dashboard charts. Each band represents the NHCI phase that Bitcoin was in on that specific day - green for Bottom, blue for Accumulation, orange for Hot Zone, and red for NeverHodl™.
The bands appear on both charts simultaneously - the BTC Price chart and the NHCI Score chart - giving you a complete visual history of every cycle phase since 2017. They are OFF by default. You discover and activate them via toggle buttons below the chart.
The 4 phases explained
Each phase corresponds to a range of the NHCI Score (0–100). The bands highlight days when the score fell within each range - giving you an instant visual map of cycle history.
Why is Bull (45–65) not shown? It covers 54% of all historical days. Showing it would paint most of the chart amber - noise, not information. The phases that matter for decisions are the extremes: opportunity zones and risk zones.
How to activate Cycle Zones
- Open the NeverHodl™ Dashboard
- Below the chart, find the PHASES row with colored dot buttons
- Click individual phases (Bottom, Accum, Hot, NH) to toggle each one, or click ALL to show/hide everything at once
- Bands appear on both charts (BTC Price + NHCI Score) simultaneously
Your preferences are saved automatically - when you come back tomorrow, the same bands will be visible.
Tip: In the screenshot above, you can see the PHASES and OVERLAYS rows at the bottom of the chart. The colored buttons (Bottom, Accum, Hot, NeverHodl™) each toggle one phase band. The RISK row at the top lets Pro users switch profiles.
Overlay signals: Correction & Descent Guard
Below the phase buttons, you'll find the OVERLAYS row - two additional signals that layer on top of the phase bands.
Overlays are additive - they render on top of the phase bands, giving you two layers of information at once. Overlay signals are a Pro feature ($9/mo) - they provide the advanced context that helps you distinguish between a temporary pullback and a real trend reversal.
Risk Profiles: Customize your zones (Pro)
Not every investor has the same risk tolerance. Pro subscribers can switch between 4 risk profiles that shift the phase thresholds - and the bands recalculate in real-time.
All 4 profiles are calibrated using a quantitative backtest of 3,423 days of real NHCI data (2017–2026), with time-weighted scoring to prioritize modern market conditions.
Reading the chart: what to look for
- Long green stretches = Extended accumulation windows. Historically the best moments to build positions. The longer the green band, the deeper the opportunity.
- Red bands after extended bull = Time to review your exit strategy. When red appears after months of no red, the cycle is reaching its peak.
- Orange correction overlays during bull = Temporary weakness. The macro trend is intact - these pullbacks are often opportunities within a bull market.
- Red Descent Guard during hot zone = Potential cycle top forming. The score is falling from elevated levels - high alert for a possible transition to bear territory.
Key takeaways
- Cycle Zones paint the NHCI phase history directly on the chart - no mental mapping needed
- 4 phases shown: Bottom (green), Accumulation (blue), Hot Zone (orange), NeverHodl™ (red). Bull omitted intentionally (54% of all days = noise)
- Overlay signals (Correction & Descent Guard) add context without replacing the phase bands
- Risk Profiles (Pro) let you customize the thresholds to match your investment style
- Bands appear on both charts simultaneously and your toggle preferences are saved automatically
Try Cycle Zones on the live dashboard
Cycle Zones show you where opportunity and risk appeared - across 9 years of Bitcoin history. The NHCI Score updates every hour, free, no registration.
Disclaimer: The NHCI Score is an educational market data tool. It does not constitute financial advice. NeverHodl™ does not tell users to buy or sell - it shows the data and the opportunity. The user decides. Past performance does not guarantee future results. Always DYOR. MiCA EU 2023/1114. OEPM M4370276.